Analyze This: Chart Figures and Their Interpretation. Part 3

The crypto market can exist in three states: in a trend, prepared for a turn, or stuck in a state of uncertainty, keeping traders on their toes. By analyzing the charts of technical analysis and the figures they produce, it is possible to determine the optimal entry points to the market, the right moment to "drain" the assets, and predict which way the trend will move further.
In our previous reviews, we talked about how to achieve such results if the charts depict a "head and shoulders" pattern, show a "double top" or a "double bottom,” or slow trade by producing a "triangle" figure.
The Wedge
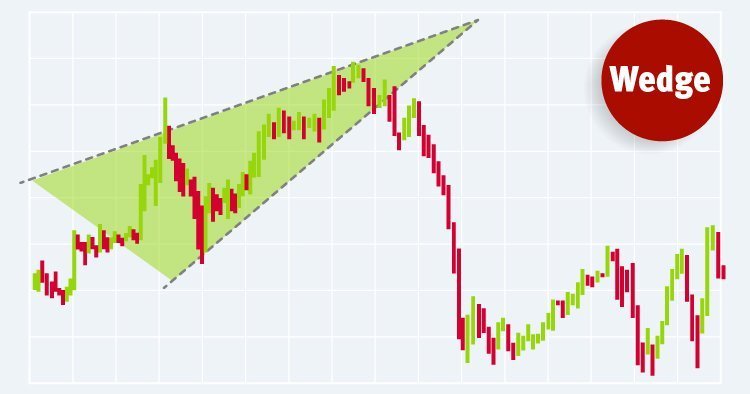
Inexperienced traders often make the mistake of confusing a triangle with a wedge. These patterns can give quite opposing signals. It is very easy to mix the two up, and so to clear the confusion we will outline the main distinctive features once and for all:
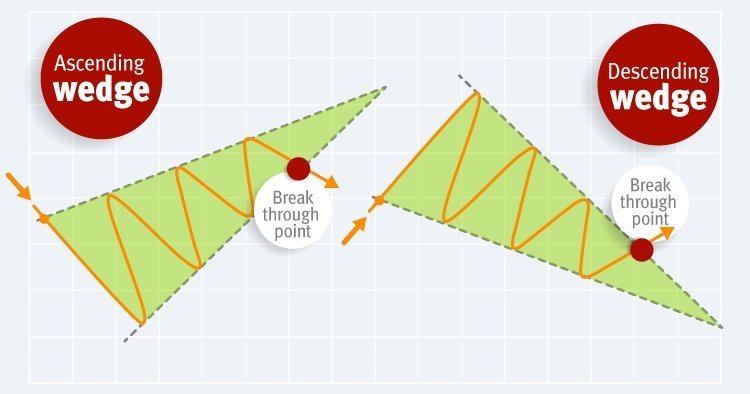
Unlike a triangle, in which one side can be absolutely horizontal, both lines of the wedge always go at an angle to the horizontal, that is upwards with the ascending wedge and downward with the descending one.
In contrast to the triangle, the wedge is always directed either upward or downward.
Carefully draw your conclusions after making sure that you are still dealing with a wedge and not a triangle. First, just as in the case with other patterns, do not rush to open a new deal before the end of the formation of the figure. Secondly, remember that the wedge is a fairly strong pattern, and the price can change its direction quite sharply after its completion.
The transaction should not be opened until the moment when the price breaks the lower edge of the wedge when dealing with an ascending wedge. The signal to buy an asset will be a price break through the upper edge of the figure when dealing with a descending wedge.
Flag and Pennant
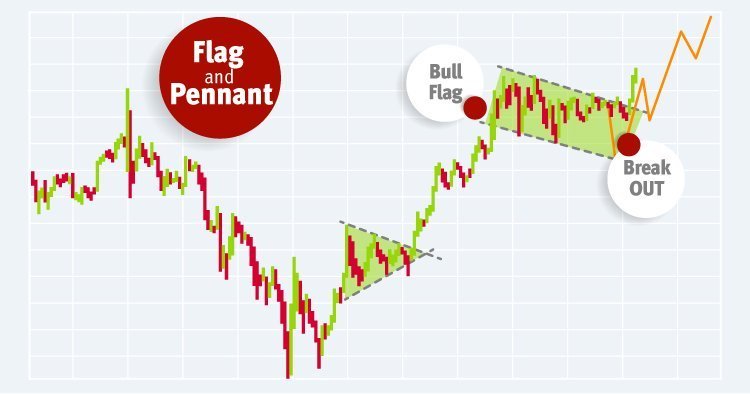
Both of these figures are rare on graphs, as they have a shaft in the form of a trend preceding them and a panel that has a slope opposite the "shaft.”
As a rule, the flag is formed against the backdrop of active growth (the bulls of the market who expect trends, and traders who bet on rising asset values call this flag a "bullish" one), or a fall in price (a "bear" flag signaling a fall in the value of assets). This canvas has a slope against the main trend (the shaft) and is limited by parallel lines of support and resistance. Each subsequent maximum or minimum price within the bullish flag will be lower than the previous one. Therefore, it is best to enter the position after the breakdown of the previous maximum and resistance level.
The main difference between a pennant and a flag is that the support and resistance lines of the latter are not parallel, and price fluctuations result in a triangle. The pennant is encountered on the market more often than the flag. A reasonable point for entering a long position is the breakdown of the triangle and the price of the last maximum.
Cup and Handle
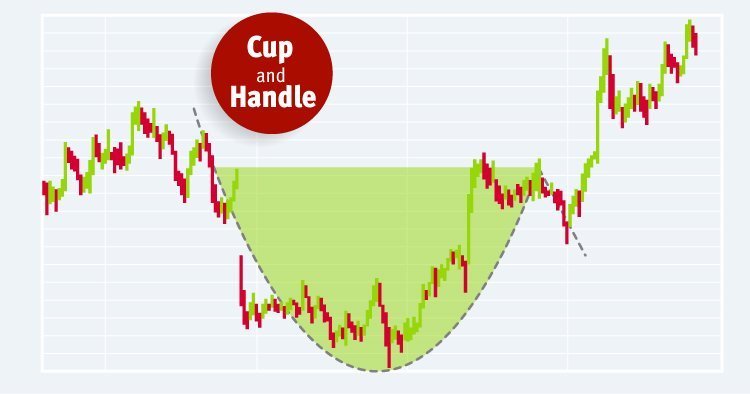
This is the figure confirming the uptrend and is displayed on the graph in the form of a deep depression and insignificant breaks from the resistance line after the completion of the arc. The local maximums of the "cup" should be located approximately at the same level. It is possible to go into position once the handle is formed and the price breaks through the resistance line.
We sincerely hope that the charts of technical analysis no longer look so intimidating to you.
Best of luck on the market!