Analyze This: Do I trust Fibonacci?

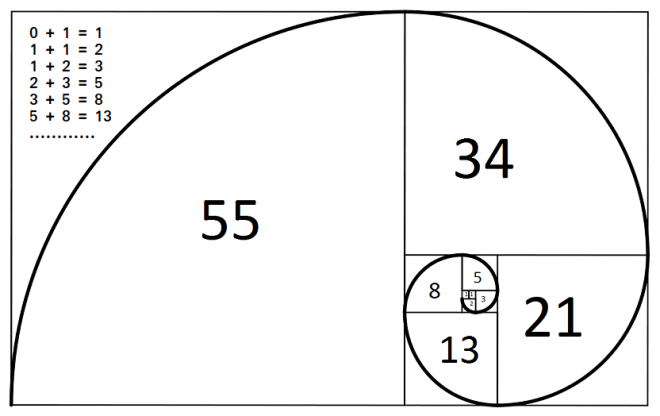
Leonardo of Pisa, a medieval traveler and mathematician, is better known to descendants under his nickname of Fibonacci. The numerical sequence developed by him, in which each successive number is equal to the sum of the two previous ones, is something like Leonardo's golden mean, only in mathematics. The Fibonacci sequence can be traced at the stages of growth of spruce cones, shells, sea waves, and even in the structure of the human brain. It would be strange if proven sequence-loving technical analysts neglected the Fibonacci number.
Traders acknowledged Fibonacci after noticing that price fluctuations repeat the famous numerical sequence quite frequently. The first to notice this was the American R. Fisher, who described a hypothesis in his book "Fibonacci Applications and Strategies for Traders."
By repeatedly testing the given hypothesis, traders became convinced that there is a correlation, and it was so convincing that the Fibonacci indicator became one of the most popular tools of technical analysis and was even built into the automatic settings of a number of trading terminals that traders work with.
For example, by using Fibonacci calculations based on price movement, the MT4 terminal automatically sets correction levels located between the beginning and the end of a price movement. Fibonacci levels reflect the percentage of the total trend movement. The most popular correction levels are 23.6, 38.2, 50.0, 61.8, and 76.4 percent. Most often the price, based on the level of support or resistance, returns exactly to these values. These points are considered the most favorable for entering the market in a long position. At the same time, stop loss is visible on the other side of the Fibonacci level.
The first level, 23.6%, is a point at which the trend can either continue its movement or succumb to a corrective rebound with equal probability. Having broken this level, the next stop is 38.2%. If this level manages to withstand resistance, then the price will return to the previous level of 23.6%.
Overcoming 50% of the price and moving in the direction of 61.8% is quite a serious confirmation leading to the final phase of the trend, which comes after overcoming the resistance line at 61.8%. After this, we need only wait for the 100% mark and the reversal of the trend.
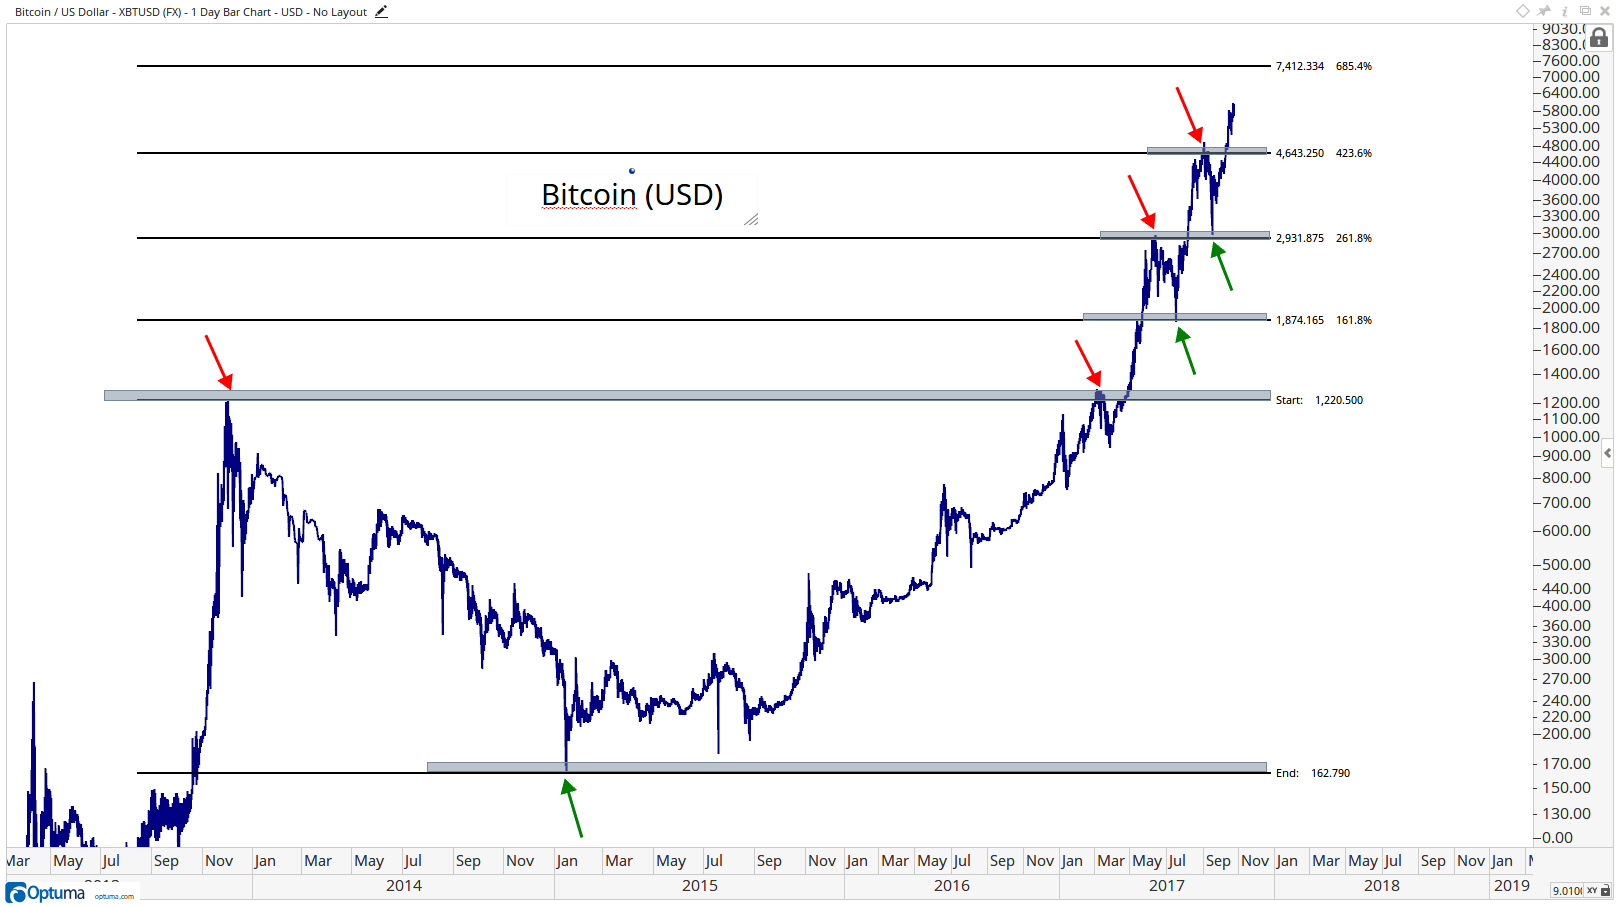
Levels outside the price movement, located as a rule at positions of 138.2% and 161.8%, are called expansion levels. One can use them to estimate the direction the price will take. These are also the best points for getting out of the market. It is easy to see that levels with a difference of 100 units repeat the correction levels.
The Fibonacci line is so popular with traders that it is used almost everywhere, conforming the behavior of traders and a turning into a kind of tradition in trading strategies. As a rule, the volume of the market grows upon approaching these levels. Under these conditions, Fibonacci levels become strong support or resistance factors and successfully replace the structure of strong price levels. Breakdowns or rollbacks from one of the Fibonacci lines traditionally provoke an explosive effect and trigger pending orders and, given the size of the market, they can affect the trend as a whole.
It is imperative to take into account that the closer the price to the Fibonacci level, the more likely we are to see speculative hikes. In order not to fall into this trap, it is better to wait for trend certainty, and open positions only after confirming the direction of the trend.
The location of the Fibonacci levels does not change depending on the selected timeframe, but the forecast will be more valid if you build it from a longer period to a smaller one, as this will allow for identifying the intermediate corrections necessary to form a complete picture of the trend’s behaviour.